Culture-dependent Experiment:
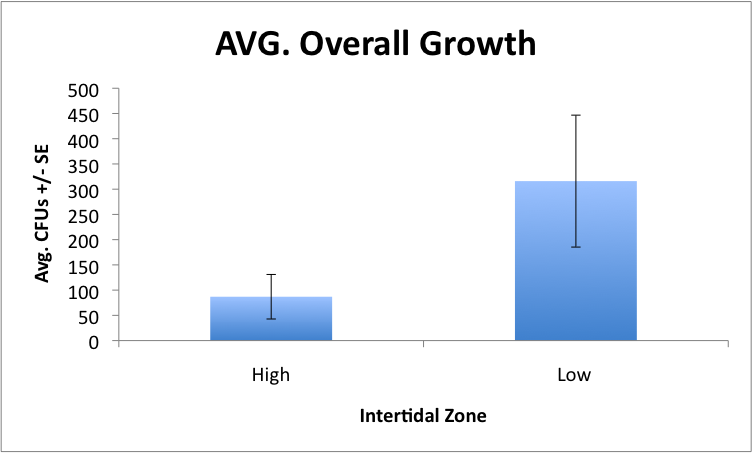
After 48 hrs of growth these plates were put into the refrigerator on Tuesday Aug 10, 2010 to suspend growth. Today, we counted the number of CFU's present on ASWA and TCBS media inoculated with mucus from low and high intertidal anemones. These are our results for the average CFUs for both TCBS and ASWA for each tidal zone. There is a significant difference between groups. Not shown, there is also a significant difference between growth on ASWA, but not on TCBS due to one high intertidal plate with a lot of Vibrio growth.
Collection Trip to Cattle Point:
We examined our mucus+UV treated plates inoculated with 3 bacterial strains this morning... there was no difference from controls... but this might be because the protein based antibacterial compounds that are potentially in the anemone mucus degraded over the 2 days it took our ASWA plates to dry enough to inoculate. So we decided to try the experiment again with high intertidal anemones since these anemones show the most potential for producing antibacterial activity based on our preliminary culture and PCR results.
Drew and I went back to Cattle Point over lunch to gather 7 additional high intertidal anemones so that we can repeat the mucus challenge. These anemones were collected in 3 tidal pools completely isolated from water flow during high tide. Anemones were collected as before (8/8/10), such that each anemone was carefully taken off the rock with a metal spatula, rinsed with FSW, and placed in a falcon tube filled with FSW. Back at FHL we placed each anemone in glass custard dishes filled with FSW and placed them in the recirculating seawater tables for temperature control. Tomorrow we will plate the mucus onto ASWA and inoculate with 4 different bacterial cultures.
qPCR:
We ran a qPCR set-up exactly as our conventional PCR from 8/12/10 with universal bacterial primers 27F-1492R.
We set-up at 25 ul rxn as follows:
1.5 ul BSA
0.5 ul 20 uM 27F
0.5 ul 20 uM 1492R
8 ul PCR H2O
12.5 ul Stratagene 2X PCR Mix
3 ul of DNA template from low1-12, high1-12, seawater1-2, and No template controls1-2 were pipetted into the 96-well plate first. 22 ul of the master mix was secondarily added and pipetted to mix.
qPCR Thermal Profile
1. 95 for 7:00
2. 95 for 0:10
3. 60 for 0:30
4. 72 for 0:30
5. Repeat 2-4 40 times
6. Melting curve
a. 95 for 1:00
b. 55 for 0:30
c. 95 for 0:30
Unfortunately, our results were all over the place and very unclear. Taken from Morgan's e-mail explanation: "The no template control
had the lowest CT at 32.8, followed by our seawater samples (33.0), our high zone samples (33.5), and our low zone samples (34.2). Recall that around half of the high zone samples did not even amplify with conventional PCR. Furthermore, two of the samples that did not
amplify at all with conventional PCR had the lowest Ct values (i.e. the most product). We get two bumps in the dissociation curve, one in the mid 60's and one in the mid 70's." This could be due to primer dimers? But, we didn't have any primer dimer bands on the conventional PCR gel. We are now considering taking a semi-quantitative PCR approach because these results are so weird.
Aug 12, 2010
Conventional PCR using our new universal bacterial primers to determine whether we extracted enough bacterial DNA from our anemone mucus in all our environmental samples and to examine the extent of extraction contamination.
12.5 ul Reaction * 62 rxns
6.25 ul GoTaq
0.25 ul 20 uM 27F
0.25 ul 20 uM 1492R
0.75 ul BSA
4 ul water
2 ul DNA template
This turned out quite well with 1200 bp products, as expected, in all mucus samples collected from low intertidal anemones (n=12). Interestingly, we only amplified products in 5 of the 12 anemone samples from high intertidal anemones. We were intrigued by this results, which suggests the high intertidal anemones are nearly devoid of a microbial assemblage. We went back to the mucus samples plated onto ASWA and TCBS media and found that the same pattern existed. A significantly greater number of CFU's grew on media inoculated from low intertidal anemones than high intertidal anemones.
Antibacterial Mucus Exp.
Inoculated our mucus and UV treated plates with 3 bacterial isolates that were grown overnight in marine broth (Vibrio tubiashii, unknown Vibrio, and unknown yellow bacterium). I plated a 10^-6 dilution onto 2 UV treated control plates without mucus and 4 mucus+UV treated plates - 2 from high intertidal anemone mucus and 2 from low intertidal anemone mucus. We plated 18 plates in total. We will let these grow at RT overnight and examine whether there is any difference between controls and mucus treated plates. We are a little concerned that we plated the mucus 1.5 days ago, but could not inoculate until today because they were not dry. It is possible that whatever antibacterial compounds were in the mucus have become inactive at this point. We may try plating mucus again on fresh plates to see if they are less goopy than this set.
Aug 11, 2010
One of those days in the lab when nothing seems to go your way, but we finally have a qPCR running, so lets hope it works...
Antibacterial Mucus Exp.
We came in this morning hoping to plate our 3 cultured isolated onto high and low-tide anemone mucus that we plated and UV sterilized and left to dry overnight. However, the plates were still very runny and didn't seem to be drying well. We thought there might have been something wrong with the media, but decided to let them dry during the day and come back to them in the evening... meanwhile Lisa graciously poured us another set of plates (Difco 2216), but we don't have any more anemone mucus from the high intertidal... so maybe we'll just try it from the low intertidal tomorrow.
Quantifying our DNA:
We wanted to know exactly what concentration of DNA was in all our samples after we extracted DNA using the Qiagen Stool Kit. We have 46 total samples, but decided to try to quantify a single sample from each treatment or sampling type. Again, our samples came from low intertidal, high intertidal, seawater from the site. Samples also came from Marie and Loni's challenge study with: V. tubiashii, Heat Stress, Vt + Heat, and Control from this experiment, and finally two extraction controls from two kits. We decided to try a PicoGreen kit to quanitfy our DNA using the qPCR machine.
We added:
14 ul TE Buffer
15 ul PicoGreen working stock
1 ul DNA template and/or standards
PicoGreen Working Stock (1:200)
3.7 ul PG + 731.3 TE
We ran the following samples: low standards, high standards, and L1, H1, NEG1, SW1, Con1, HS1, VT1, VH1
This sort-of worked, but we decided the results would be biased by the eukaryotic DNA from the anemone and zooxanthellae that is inevitably in the samples. But, it may not be necessary to quantify our DNA prior to amplifying because we can compare our final qPCR results for each specific bacterial primer to the universal bacterial primer essentially using the the universal primer as our standard for quantification.
Our qPCR primers finally came in! So we decided to set-up a qPCR with our universal primers and 2 samples from the environmental samples to make sure we could get decent results and clean negative controls. We ran the following samples in duplicate (n=16): L1, L2, H1, H2, SW1, SW2, NEG1, and NT control.
25 ul qPCR RXN Mix
2X Strategene SYBr Mix 12.5 * 18 = 225 ul
BSA 1.5 * 18 = 27 ul
10uM 27F 0.5 * 18 = 9 ul
10uM 1492R 0.5 * 18 = 9 ul
Water 8 * 18 = 144 ul
Total = 23ul
DNA Template = 2 ul
Thermal Profile
1. 95 for 7:00
2. 95 for 0:10
3. 60 for 0:30
4. 72 for 0:30
5. Repeat 2-4 40 times
6. Melting curve
a. 95 for 1:00
b. 55 for 0:30
c. 95 for 0:30
Our qPCR didn't turn out very well. We had contamination in our extraction control and contamination in 1 of our 2 no-template controls. The CT was very high, indication low DNA yield in the majority of our samples as well. We will try a standard PCR tomorrow to try to discern some of these problems
Aug 8, 2010
Anemones of the genus Anthopleura elegantissima were collected from Cattle Point, along the Southwest coast of San Juan Island, Washington. Low intertidal anemones were collected on August 8, 2010 at 10:00AM during a -2.2 foot low tide (n = 12). High intertidal anemones were collected several hours later at 2:30PM when the tide was at 2.0 feet to allow for the longest exposure prior to tidal inundation (n = 12). A 1 L bottle of seawater was collected from the low intertidal region for comparative analysis. Each anemone was carefully excavated from the substratum using flat, round-tipped metal lab spatulas. While wearing gloves, anemones were rinsed in 0.2 µm filtered seawater (FSW) and placed into sterile falcon tubes containing FSW. Anemones in falcon tubes were transported in coolers back to the lab at Friday Harbor Laboratories, San Juan Island, Washington. Upon arrival anemones were sampled for mucus (see below) and placed in sterile glass dishes containing fresh FSW. Glass holding dishes were set into seawater tables to maintain ambient seawater temperatures.
To collect mucus for culture-dependent and –independent analysis, each anemone was placed in a sterile plastic weigh boat and swabbed with three sterile cotton swabs. One swab was placed in 200 ul FSW for downstream fluorescent in situ hybridization (FISH). A second swab was placed in 1000 ul of HSL extraction buffer (QIAGEN). Swabs were swirled in FSW or buffer for several seconds to remove the mucus and then maintained at 4˚C until downstream filtration for microscopy or DNA extraction, respectively. The third swab was streaked onto both seawater agar (SWA; Difco 2216©) and Vibrio spp. specific (TCBS) media.
Russell was our lab tech for the day and did a great job helping collect and swab anemones :)
Aug 7, 2010
Played with microscopes, specifically the Epifluorescent in Fernald.... nothing worked, especially since the immersion oil had autofluorescence
Aug 6, 2010
We started the day by meeting with Carolyn to talk about FISH and whether our proposed research was feasible. We talked about which probes to start with (probably the universal EUB338), and how exactly to filter/fix with the equipment and reagents we have available. We decided to fix our samples after filtration through a 0.2 um polycarb membrane in 10% formalin and filtered sea water. We determined that formalin should work as well as using 4% PFA (paraformaldehyde) recommended in my protocol. Briefly this was the protocol we decided to try:
- Swab mucus from anemone
- Suspend mucus by swirling swab in 200 ul FSW
- Filter suspended mucus onto 0.2 um black polycarb filter (25 mm diam)
- Fix filter by placing on a 200 ul drop of 10% formalin FSW for 2 hrs or overnight (in Petri dish)
- Wash filter with PBS (phosphate buffered saline) 3X by placing onto the filter apparatus
- Let dry
- Place filter onto a 200 ul drop of appropriate stain (Sybr/Probe etc) for 15 minutes (in the dark, in a Petri dish)
- Keep filters in the fridge in a parafilmed Petri-dish or 6 well plate when not in use.
Then we spent the entire afternoon looking for the apropriate size filtering apparatus, clamps, flask, vacuum pump, tubing etc. We finally found everything we needed in various locations including the main stock room, gated stock room, and lab 10 (of course we asked before we moved anything in lab 10). Finally, we had to get formalin from the hazmat closet under Fernald (Morgan graciously risked her life to recover some formalin from the closet for us to use).
We decided the first step would be to test the concentration of mucus that would yield an optimal density of bacterial cells for enumeration by serially diluting the mucus, filtering, and staining the filter with a general nucleic acid stain (e.g. Sybr Gold, Sybr Green, Ethidium Bromide). Matt helped make the serial dilution series by swabbing each anemone, placing the mucus in 100 ul of FSW, then serially diluting to 10^-1 and 10^-2. We then added an additional 100 ul to each tube to bring the volume up to 200 ul (an optimal filtering volume).
Antibacterial Mucus Exp.
We checked the plates from yesterday, but for whatever reason bacteria was never plated onto the control plates so we didn't have a good comparison for the mucus/UV treated plates. However, there was some bacterial growth on the mucus treated plates, so maybe they don't have much in the way of antibacterial properties in the mucus. But, we will run this experiment in a more quantitative way once we collect anemones from the low and high intertidal on Sunday.
qPCR instead of FISH? (or both)
Drew and Steven felt we should have a fall back option if FISH didn't work. So we decided to order 7 different bacteria-specific primers for the following groups that we could use with qPCR. All these primers except for the Cyano have been tested and published, so we have faith that they will work on our anemone mucus samples, fingers crossed. The cyano primers came from a friend at Auburn (Justin Havird) who has been testing and optimizing primer design specific to cyanobacteria.
| Bacterial Taxa |
F- Sequence 5' to 3' |
R- Sequence |
Reference |
| Alphaproteo |
ALF28F: ARCGAACGCTGGCGGCA |
ALF684R :TACGAATTTYACCTCTACA |
Ashelford et al. 2002 (F) and Muhling et al. 2008 |
| Gammaproteo |
GAMMA395F: CMATGCCGCGTGTGTGAA |
GAMMA871R: ACTCCCCAGGCGGTCDACTTA |
Muhling et al. 2008 |
| Vibrio |
VF169: GGA TAA CC/TA TTG GAA ACG ATG |
VR744: CAT CTG AGT GTC AGT G/ATC TG |
Yong et al. 2006 |
| Actinobacteria |
S-C-Act-235-a-S-20 CGCGGCCTATCAGCTTGTTG |
S-C-Act-878-a-A-19 CCGTACTCCCCAGGCGGGG |
Sach et al. |
| Cyanobacteria |
CGTAGGTTGCGACCCTAAGGCTGA |
GCATACATCGCCATCATTTCACC |
Havird (unpublished) |
| Universal |
27F: AGAGTTTGATCMTGGCTCAG |
1492R: TACGGYTACCTTGTTACGACTT |
|
| Acidobacteria |
ACD31F GATCCTGGCTCAGAATC |
1492R |
Barns et al. 1999 – 58o annealing T, 30 cycles |
Aug 5, 2010
Antibacterial Mucus Exp.
First we checked for growth on our anemone mucus treated plates that were UV sterilized the previous day. There was no growth, thus the 10 min UV prep was enough to kill the bacteria in the anemone mucus. Matt plated colonies of bacteria previously isolated from anemone mucus onto the UV treated mucus plates, as well as control plates. We'll check back on these tomorrow.
FISH:
I obtained a FISH protocol from Dr. Koty Sharp who run a FISH workshop in Florida. I also spoke to her on the phone about the necessary positive/negative controls in addition to competitive standards and which fluorophores to choose. In general it's important to order HPLC purified probes. We decided it was important to have both a labeled universal bacterial probe (EUB338) and a labeled non-universal bacterial probe (EUBNON) that binds to everything but bacteria. Also, apparently probes for Gamma- and Beta-proteobacteria target a very similar region of the 16S region, so it's important that we get a labeled Gamma probe (our target) and a non-labeled Beta probe to ensure specificity and to reduce non-specific binding to Betaproteobacteria. After this discussion and looking at all the microscopes on campus on a guided tour by Drew, we decided on these 5 probes. We're unsure of which fluorophores to choose until we settle on the microscope we will be using and determine which filters it has.
- Universal (EUB338; labeled)
- neg cont (EUBNON; labeled)
- Gamma-proteobacteria (Gam42a;labeled)
- Alpha-proteobacteria (ALF968; labeled)
- Beta-proteobacteria (Bet42a; non-labeled)
We decided to start by only ordering the EUB338 universal bacterial probe labeled with Cy5 from Eurofin Operon MWG Biotech. We also ordered an additional Qiagen Stool Kit for extraction of all our anemone mucus samples.
This afternoon we spent 1.5 hrs getting trained to use the confocal in lab 8. However, it's a fairly old scope with equally old computer software. And, although it seems to work fine for simple jobs, we decided we really only need to use an Epifluorescent scope for our imaging, not a confocal. So we decided to take a look at the Epi in the basement lab of Fernald.
Here are the dyes/excitation wavelegths that are compatible with the epifluorescent scope here:
- FITC/HYQ/ALEXA-488 (Excitation 460-500)
- DAPI/ALEXA-420 (Excitation (400-418)
- G-2E/G-TRITC (Excitation 528-553)
Aug 4, 2010
FISH (Fluorescent in situ hybridization):
Instead of qPCR with taxa specific bacterial primers the anemone group (Kathy, Morgan, Matt) are considering using FISH instead, we did some preliminary research this afternoon.
Morgan and I cross referenced publications and probe queries on probebase (http://131.130.66.201/probebase/) to find probes specific to particular bacterial groups of interest. We hope to order these probes with a Cy5 fluorophore at 5' end. These primers will bind to the target bacteria within the anemone mucus and fluoresce under specific wavelengths of light so that we can both ennumerate and partially identify the bacteria in our samples. Another great FISH reference site: http://www.arb-silva.de/fish-probes/fish-protocols/
|| Bacterial Taxa || Sequence || Probe || Reference ||
| Alphaproteo |
GGT AAG GTT CTG CGC GTT |
ALF968 |
Neef 1997 |
| Betaproteo |
GCC TTC CCA CTT CGT TT |
BET42a |
Manz et al. 1992 |
| Gammaproteo |
GCC TTC CCA CAT CGT TT |
GAM42a |
Manz et al. 1992 |
| Vibrio |
AGG CCA CAA CCT CCA AGT AG |
GV |
Eilers et al. 2000 |
| Actinobacteria |
TCC GGT CTC CCC TAC CAT |
Actino-658 |
Kong et al. 2005 |
| Acidobacteria |
CTG AGA TGG TTC ACT TCC |
LS_HOL189 |
Meisinger et al. 2007 |
| Cyanobacteria |
AGA GGC CTT CAT CCC TCA |
405_Syn |
West et al. 2001 |
Differential Display Results:
We ran a PCR overnight on all three cDNA libraries constructed at Cornell (Control, Aspergillus, and Labyrinthulid infected) for differential gene expression. There doesn't appear to be a dramatic difference among the 3 libraries for the 2 genes (19, 14?) we looked at during class.
Master Mix:
1 ul cDNA (3 libraries)
2 ul 5 mM arb primer
1 ul 10 uM d ACP 2
6 ul H2O
10 ul 2X See Amp Mix
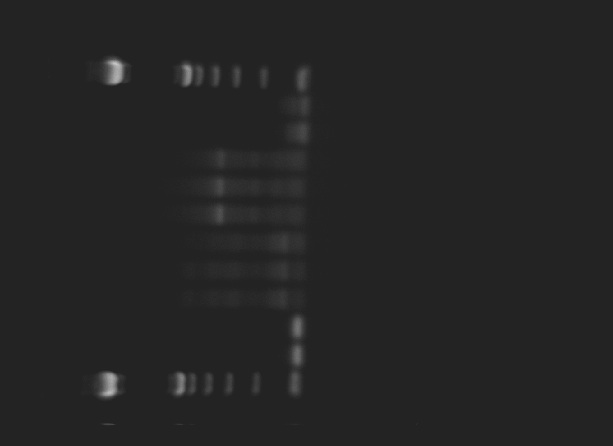
1.5% Agarose gel (115 V for 45 minutes) with our PCR products:
Lane 1: ladder; lane 2: neg control; lane 3: neg con; lane 4: 3; lane 5: 2; lane 6: 1;, lane 7: control, lane 8: spx; lane 9: Aspergillus; lane 10: neg con; lane 11: neg con; lane 12: ladder
Aug 3, 2010
V. tubiashii grown overnight in artificial seawater media
Test for protease:
a. Centrifuge culture tubes (1 mL) at 13,000 rpm for 10 min at 4C
b. Remove 100 μl of supernatant and add to a microcentrifuge tube (discard the rest of the pellet and culture supernatant)
c. Add 400 μl of 1% azocasein
d. Incubate for 30 min at 37°C
e. Stop the reaction by adding 600 μl of 10% trichloric acetic acid (TCA)
f. Incubate on ice for 30 min
g. Centrifuged at 13,000 rpm for 5 min
h. Add 200 μl of 1.8 N NaOH to a new microcentrifuge tube
i. Add 800 μl of the reaction supernatant to the tube with the NaOH
The supernatant will turn an extremely bright and obvious orange upon a positive result for the protease, it will remain whatever color the supernatant was (not always clear, might have slight yellowish tint) if it is negative for the protease
Azocasein Protease Assay use in detecting pathogenic Vibrio spp.
Our V. tubiashii culture produces protease and turned bright ORANGE! Yay! Protease is an enzyme produced by bacteria to conduct proteolysis, or the breakdown of proteins. Protease begins catabolism by hydrolysis of the peptide bonds that link aa's together in the polypeptide chain forming the protein. Proteases work best in acidic conditions
Hasegawa, H, Lind, E.J., Boin, M.A., Hase, C.C. The Extracellular Metalloprotease of Vibrio tubiashii Is a Major Virulence Factor for Pacific Oyster (Crassostrea gigas) Larvae. Applied and Environmental Microbiology, July 2008, p. 4101-4110, Vol. 74, No. 13.
Also cleaned up lab this afternoon.
Played with Oyster larvae (e.g. counted live vs. dead in all treatments, changed water etc.).
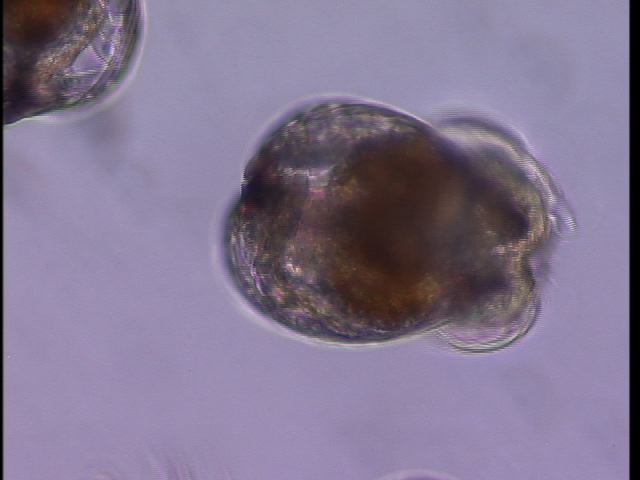
What a pretty veliger :)
Set up a Differential Display with seafan samples sent from Drew Harvell's lab at Cornell University.
Differential Display:
We will use differential display to examine genes differentially expressed in seafan blades inoculated with pathogen (SPX labyrinthulid and Aspergillus) and controls not exposed to pathogens.
Aug 2, 2010
PCR with universal bacterial primers on anemone mucus extracted yesterday with the Qiagen Stool Kit
25 ul rxn
- 12.5 ul 2X Promega GoTaq
- 1.5 ul 10X BSA
- 1.0 ul 10uM 27F
- 1.0 ul 10uM 1492R
- 2 ul DNA template (hotstart @ 95C)
Thermal Profile:
Product Check
- Agarose gel (0.5 g agarose/ 50 ml buffer/ 5 ul Ethidium bromide)
- Loaded 5 ul PCR product and 7 ul 1 Kb ladder
- Run at 115 V for 30 minutes
Serum Agglutination Test
a. To the control slide add 50 uL of sterile seawater and 25 uL of your culture to a slide.
b. To a 2nd slide (experimental slide) add 25 uL of sterile seawater and 25 uL of the V. tubiashii culture and 25uL of the thawed polyclonal antibody.
c. Gently mixed solutions on both slides by pipetting up and down slowly
d. Incubated at room temperature for 5 mins
e. Viewed at 10x or 4x on the light microscope to compare degree of agglutination of the cells.
V. tubiashii made very apparent clumps of cells on the slide with the polyclonal antibody, in comparison to the control.
Ennumerated ASWA plates inoculated with V. tubiashii cultures at 6 concentrations
Inoculated 2 1L flasks of artificial seawater media with 3 colonies of VT and incubated at RT overnight
After O/N growth, Emma plated a dilution series to determine the concentration of VT in our media.
These are the CFU counts after O/N growth:
10^-3 TNTC
10^-4 TNTC
10^-5 1052
10^-6 155
10^-7 21
10^-8 2
We used the following formula to calculate the # of CFU/ml in our inoculated media:
CFU/ml = # colonies counted * dilution factor * plate dilution
1.55 x 10^9 = 155 colonies * 10^6 * 10
Aug 1, 2010 (Sunday)
DNA Extraction:
I used the Qiagen Stool Kit to extract DNA from the 5 A. elegantissima Morgan and I swabbed yesterday. I included one negative extraction control. The initial incubation was between 85-90 degrees rather than 70 to lyse gram + bacteria. The only other amendments to the protocol were to use 1 ML lysis buffer and 1/3 of an inhibition removing tablet because we started with such a small quantity of DNA from the mucus swab. These samples are being stored at -20oC (volume = 200 ul) in the left freezer.
July 31, 2010 (Saturday)
This morning we met in lecture to discuss aligning multiple libraries using CLC Genomics Workbench. In general is it best to:
- Trim to quality sequences (suggestions: use quality (0.05) defaults and ambiguity (2.0) defaults and discard reads < 25 bp)
- Perform de novo assembly to annotate consensus sequences (if you don't have access to a reference genome)
- RNA sequence analysis on each individual library (in this case infected vs. uninfected abalone) on unique reads that didn't match any of the EST's in the database, Then run an RNA sequence analysis on any common reads. It is best to perform this analysis multiple times with different optimization parameters until you're happy with the result (suggestions to start with: max # hits for per read = 5, and max # of mismatches per read = 2).
- You could continue at this point to compare/contrast genetic differences between population/sites/ geographic areas/ infected vs. uninfected etc. using DIP (Deletion Insertion Polymorph. detection) or SNP (Single Nucleotide Polymorphism detection).
Cattlepoint Field Collection:
Marie, Loni, and myself collected 15 Anthopleura elegantissima anemones from the lighthouse point at Cattlepoint intertidal. We used a thin metal spatula to remove each anemone from high intertidal pools without disturbing the pedal disc. These pools were being washed with tidal water and were not completely stagnant. The low tide was not low enough to collect anemones from low intertidal pools, but it should be perfect on Aug 8 and 9, 2010 with a -2.0 tide. Ten anemones were collected and placed into seawater in a zip-lock bag. I used gloved hands to collect 5 additional anemones and place them in sterile 50 ml falcon tubes with water from the pools they were collected from. These 5 anemones were subjected to additional microbial sampling upon arrival at the lab at FHL.
- Morgan and I decided to try several methods of plating for culture and swabbing for bacterial DNA. The first 2 anemones were placed on weigh boats and swabbed twice.
- The first swab we placed into 300ul Qiagen Stool Kit lysing buffer and swished it around to remove the mucus, and then refridgerated O/N. The second swab was swiped across ASWA (artificial seawater agar, DIFCO 2216), parafilmed, and left to grow O/N at RT.
- The mucus + seawater remaining in the falcon tube was refrigerated O/N and will be centrifuged Sunday or Monday to concentrate mucus for plating purposes.
This procedure was repeated for the remaining 3 anemones with the addition of a sterile seawater wash of each anemone polyp prior to swabbing.
July 30, 2010 (Friday)
We spent some time this morning going over primer design in the computer lab. Some suggested resources are Genious, Primer 3, NCBI, and Amplify. I took some notes on this, but I'll add more as I learn how to use Genious on my own.
Argyle Bay Collecting Trip:
Mopalia chitons (mossy haired) were reported to be diseased/sick. We collected apparently healthy and diseased organisms from shallow water inlet at Argyle Bay. We considered chitons to be healthy if they clung to rocks well after being prodded a couple times. We considered chitons diseased if they were easily removed from the rocks, had fallen off the rocks and were laying oral side up, or did not respond to touch by curling into a ball. Chitons were brought back to the lab in separate healthy and diseased zip-lock bags of seawater and swabbed for cultivatable bacteria. Swabs were plated on ASWA and TCBS media.
3 animals sampled: 1. Apparently healthy, 2. In disease bag but didn't look diseased, 3. Obviously diseased
Swabs collected from 1. and 2.:
- girdle
- foot
Swabs collected from diseased chiton:
- foot
- girdle without lesion
- lesion on girdle
- lesion on shell
- shell without lesion
Protein Extraction and Western Blot, Take 2:
Following the same protocol as reported on July 28-29, 2010 we decided to try a 2nd protein extraction and western blot. Morgan read that previous researchers had more luck expressing protein extracted from anemone tentacles rather than the entire anemone body. Thus, Morgan extract protein from Anthopleura elegantissima tentacles and I extracted protein from Metridium senile acontia. Loni and Marie extracted protein from a barnacle and we decided to use Oyster protein that Dr. Bob previously extracted and successfully expressed on a Western Blot last night, this would serve as our positive control. We loaded 50 ul onto our SDS-PAGE and ran at 150V for ~30 minutes.
July 29, 2010 (Thursday)
SDS-PAGE cont'd
We ran a 2nd SDS-PAGE (same as July 28, 2010 with the appropriate concentration of protein, which was 30 ul for most groups - 15 ul protein, 15 ul 2X Reducing Sample Buffer (purple). After the gel ran for 30 min at 150V, we removed the gel and ran a Western Blot.
Western Blotting:
After we separated our Anthopleura elegantissima protein (heat shocked and non-heat shocked) using SDS-PAGE, we used Western Blotting to transfer the protein to a nitrocellulose membrane. This transfer takes place using the same principles as SDS-PAGE, but applies the electric current at 90 degrees to the gel instead of parallel to the gel. The protein (negatively charged) is then forced out of the gel onto a membrane, which is positively charged, but nitrocellulose should bind nearly any protein regardless of charge - so don't touch it and transfer contaminating protein! The charge does however ensure a stronger bond between our Anthopleura protein and membrane.
1. Soak the nitrocellulose membrane for 15 minutes in transfer buffer
2. Assemble the blotting sandwich like this:
- Annode (++)
- Filter paper
- Gel
- Membrane
- Filter paper
- Cathode (--)
4. Remove from the sandwich and rinse with transfer buffer
5. Place membrane in 10 ml of Blocking Solution in a covered dish
- Ultra-filtered water (14 ml)
- Blocker/Diluent (Part A) (4 ml)
- Blocker/Diluent (Part B) (2 ml)
- Total volume = 20 ml
7. Incubate the membrane in 10 ml of Primary Antibody Solution O/N
- Blocking solution (10 ml)
- HSP 70 Antibody (3.3 ul)
- Total volume = 10 ml
9. Incubate membrane in 10 ml of Secondary Antibody Solution for 30 min, decant
10. Rinse membrane with 20 ml of water for 2 min - Repeat 2X
11. Incubate membrane in 5 ml Chromogenic Substrate until purple bands develop on the membrane (1-60 min)
12. Rinse membrane with water, 20 ml for 2 min
13. Dry the membrane on a clean piece of filter paper
It appears that we did not get any protein transfer on our Western Blot (#11), so we're going to try an additional stain called Ponceau S Stain (below) in case we did something incorrectly during the staining of the blot.
Ponceau S Stain for Western blots (from the web)This is a rapid and reversible staining method for locating protein bands on Western blots. Sensitivity is somewhat less than Coomassie blue and produces reddish pink stained bands; minor components may be difficult to resolve. The stain is useful because it does not appear to have a deleterious effect on the sequencing of blotted polypeptides and is therefore one method of choice for locating polypeptides on Western blots for blot-sequencing. The stain binds strongly to nylonbased filter media but is fine for nitrocellulose and PVDF membranes. Incubate the membrane for up to an hour in staining solution with gentle agitation. Rinse the membrane in distilled water until the background is clean. The stain can be completely removed from the protein bands by continued washing. Stain solution can be re-used up to 10 times.
Ponceau S Staining Solution (0.1%(w/v) Ponceau S in 5%(v/v) acetic acid)
1g Ponceau S
50ml acetic acid
Make up to 1L with ddH2O
Store at 4°C. Do not freeze. Alternative recipe for stain solution 0.2%(w/v) Ponceau S in 3%(v/v) acetic acid.
We made 100 ml of Ponceau S to use:
0.1 g Ponceau S
50 ml 10% acetic acid
50 ml ddH2O
Oyster Dissection (Ostrea gigas)
Oysters were dissected and the hemolymph and cardiac tissue examined for Bonamia (Protista) parasites within the hemocytes. Bonamia is a global genus with >12 species. Bonamia ostreae (P. Haplosporidia) causes Bonamiasis disease in oysters. Bonamiasis can cause 100% mortality in 12-18 months and is highly temperature dependent, with higher mortality between 12-20 degrees C. The oyster becomes watery, with yellow fraying gills and a pale digestive gland. The Bonamia appear as numerous dark circular bodies within the hemocytes.
- We each started by shucking our oyster using a butter-knife, which we forced into the shell crevice along the umbo
- After the oyster opened slightly we very carefully pulled the shells apart and separated the adductor muscle from the shell
- We used a small guage 5 ml syringe to aspirate the hemolyph from the cardiac space
- The hemolyph was smeared/dripped onto slides
- We also dissected out the heart and ventricles from the cardiac space (2 small brown/red nodule and 1 off-white nodule) A 3rd slide was made by dabbing the off-white ventricle on a kim-wipe and then dabbing it onto a slide
- All the slides were fixed in a methanol bath for ~2 minutes
- Slides were subsequently stained in Giemsa Stain for 3-5 minutes and rinsed quickly in water
- We viewed the slides under oil immersion 100X on the light micrscope
- None of us were able to find Bonamia parasites within the hemolymph, some of use thought there were fungal hyphae and spores within the hemolymph, but this was unconfirmed.
July 28, 2010 (Wednesday)
Protein Extraction
Morgan heat shocked 3 anemones from the intertidal (Anthopleura elegantissima) in 25-35 degree C water overnight. We also kept 3 anemones in ambient temperature water overnight for a control comparison. The class extracted cellular protein from all 6 anemones (0.025g) using CellLytic MT, which contains salts and detergents that disrupt lipid membranes, lyse cells, and buffer the cellular proteins to the appropriate pH.
Extraction Protocol:
1. Using a clean razor blade slice up 25 mg of anemone tissue (we accidentally added .26g instead of .026g)
2. Add tissue to 500 ul CellLytic MT solution in a 1.5 ml microcentrifuge tube
3. Homogenize the tissue using a disposable pestle, close and invert several times
4. Centrifuge for 10 min in refrigerated centrifuge
5. Transfer supernatant to a clean 1.5 ml tube - here we made another 10 fold dilution to account of our additional tissue
6. Add 100 ul of supernatant to 900 ul CellLytic MT solution and centrifuge for an additional 10 min
7. Transfer supernatant to another clean 1.5 ml tube
Normally, we would quantify the amount of protein in our samples at this point using a Bradford Assay, but the Bradford reagent was not available so we decided to run 3 volumes (10, 30, and 50 ul) of sample on the SDS-PAGE and choose our optimal concentration for the final gel to be run on Thursday.
SDS-PAGE (Polyacrylamide Gel Electrophoresis)
Process of separating proteins from one another on the basis of molecular weight. Treated proteins are subjected to an electric field and pulled through a polyacrylamide gel (vertical). Proteins are treated so that they are all the same charge and migrate based only on their molecular weight and not because of their structure, amino acid sequence, pH or other issues.
Protein gel protocol:
1. Boil water or heat block to 95-100 C
2. Mix your extracted protein sample by inverting the tube several times (do not vortex)
3. In a fresh 2mL tube, add 15 ul of protein extract and 15 ul of 2X Reducing Buffer
Reducing buffer contains sodium dodecyl sulfate (SDS, to impart an overall NEGATIVE charge to all protein in the sample), B-mercaptoethanol (reducing agent, helps break tertiary/quaternary structures), glycerol (sinking agent), Bromophenol blue (migrates at the same rate as proteins, 5-7 kDa, for visualization, and is also negatively charged), and finally a buffer (to maintain an appropriate pH).
4. Mix sample by flicking the vial, briefly centrifuge (10sec)
5. Boil samples for 5 minutes to fully denature proteins, eliminate an tertiary/quaternary structures, and lead to linear chains of aa's.
6. Set-up SDS-PAGE gel apparatus, make sure to rinse pre-pored gels with DI water prior to use
7. After samples are done boiling, centrifuge for 1 min and load onto gel
8. Run at 150V for 30-45 minutes until bands reach bottom of gel.
After the gel is done running:
1. Remove the gel cassette and crack open carefully, trim the loading wells off, and notch the gel so you remember in which direction you loaded the gel.
2. Place gel in container with Coomassie Stain
3. Incubate in stain for 3-5 min on shaker
4. Pour stain back into original container
5. Briefly rinse gel with 10% acetic acid, toss this rinse
6. Add 250 ml (approximately) 10% acetic acid to container with gel and incubate on shaker for 15 min, change out buffer and repeat until bands become clearly visible, or cover with plastic wrap and incubate in acetic acid O/N
7. Image bands on a light box (e.g. iPhone) and take a photo.
July 27, 2010 (Tuesday)
July 26, 2010 (Monday)
In Situ Hybridization (ISH) is used to localize a specific DNA/RNA sequence within a piece or section of tissue, which is why it's called in situ. A probe (labeled complementary DNA/RNA strand) hybridizes with the target sequence of interest within the tissue section, excess probe is washed away. The either fluorescent- or antigen-labeled bases within the probe are visualized using fluorescence microscopy or immunohistochemistry, respectively, and the sequence of interest lights up or stains a complimentary color. In our experiment, we used an antigen-labeled probe to target Rikketsia intrusions in Abalone with three different variations of Withering Syndrome (WS). The three variations are 1. classic; the original form identified in the Friedman lab, 2. new, and 3. stippled.
This procedure took 3 days to complete. We followed a protocol derived from Antonio (2001).
Day 1: PCR for Rikketsia-like organism (RLO) in Abalone tissue sections
25 ul Rxn:
sdw 12.3 ul
MgCl 0.75 ul
Buffer 2.5 ul
TMAC 2.5 ul
dnTP's 2 ul
BSA 10X 0.25 ul
Primer RA5-1 1 ul
Primer RA3-6 1 ul
Taq 0.1 ul
DNA template 1.5 ul
Cycling Conditions:
95 for 5 min
94 for 1 min
50 for 30 sec
72 for 30 sec
Cycle 39 times
72 for 7 min
16 (RT) forever
We used the PCR DIG-Probe Synthesis Kit (Roche Applied Sci) Cat # 11 636 090 910 to label the probe by PCR using the following reaction. We prepared one sample that included the probe and and a second without the probe as a negative control for comparison. The probe should bind to all three WS RLO's (classic, new, and stippled). We each will prepare 2 tissue slides, one with probe and one without.
25 ul Rxn
sdw 14.75 ul
PCR buffer (vial 3) 2.5 ul
PCR DIG mix (vial 2) 2.5 ul - make sure to denature at 95C/ 3 min and place on ice prior to use
RA 5-1 (20 pml/ul) 1.25 ul
RA 3-6 (20 pml/ul) 1.25 ul
Enzyme mix (vial 1) 0.375 ul
Template DNA (1:100 dilution of RLP plasmid) 2.5 ul
Tissue Deparaffinization - 1.2 hrs
July 24, 2010
After running the qPCR the previous evening, we examined the results in lab this morning. Very few people had clean negative controls, suggesting the presence of contamination at some point during the reaction set-up. Because a few people did have clean controls, the contamination was probably not in the master mix, but rather related to dirty tips, the open 96-well plate with multiple people loading, or accidental mis-loading of wells. Also, not all cDNA samples amplified, which could be due to a number of complications as well. However, we did have 3 infected samples and 3 uninfected samples that did amplify and we compared.
Some additional problems with our set-up.
We didn’t run an RNA control to determine if we had genomic DNA contamination. We also didn’t used DNase to remove any genomic DNA from our reaction. We talked about different ways we could test whether we had genomic contamination in our samples: 1. Design your primers to span an intron-exon boundary (genomic DNA contrains introns, RNA does not). 2. You could run an RNA sample on your qPCR, you won’t get amplification if there is no genomic DNA.
We analyzed our qPCR Results in Wikispace
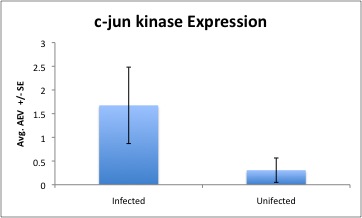
Found the expression values for both genes (c-jun kinase + actin) and corresponding negative controls using the following equation: Arbitrary expression value (AEV) =10^(-(0.3012*Ct)+11.434)
Divided the jun-c kinase AEV results by the actin AEV results to normalize
Averaged all infected/ uninfected (n=3), respectively and graphed with +/- SE
This used to look like a nice table but I got tired of fighting with Wikispace, so now it looks like this (see excel spreadsheet for accurate results).
|| || Infected || Unifected || || smple 1 || 0.207688325 || 0.817809216 || || sample 2 || 1.828285436 || 0.001924701|| || sample 3 || 2.989667409 || 0.102140078 || || AVG || 1.675213723 || 0.307291331 || || SD || 1.397292066 ||0.444951866 || || SE || 0.80672695 || 0.25689308 ||
Also note: Reactions with efficiencies less than 95% should be re-run. And you can also use a free web-based site called "Miner" to analyzed your raw data.
July 23, 2010
Making cDNA:
Making cDNA from RNA extracted from Littorina
1.17.75 ul RNA template
2. Heat RNA to 70˚C for 5 min
3. Transfer to ice for 5-10 min
4. Add Master Mix
5. Heat to 42˚C for 1 hr
6. Heat to 95˚C for 3 min
= cDNA!
Master Mix
a. 5 ul 5X MMLV bufferb. 1.25 ul 10 mM dNTP’s
c. 0.5 ul MMLV RTase
d. 0.5 ul Oligo dT primer (has lots of T’s)
= 7.25 ul total volume
Q-PCR for 2 samples (MM5, MLE#3)
2 Rxns with each cDNA template = 4
2 Rxns for negative control = 2
Master Mix
2X SYBR MM 12.5 ul * 7 = 87.5
10X BSA 1.5 ul 10.5
F Primer 0.5 ul 3.5
R Primer 0.5 ul 3.5
Clean water 8.0 ul 35
2 ul Template cDNA
We ran a qPCR on the cDNA from Littorina infected and uninfected with parasites. We used 2 sets of primers: 1. Actin as a reference gene and, 2. Jun-c as the gene of interest and prepared a separate master mix for each. Reference genes are used to normalize the results and account for error in pipetting and PCR efficiency. The gene of reference (actin) should remain stable among all organisms (diseased or healthy) and can be used to normalize any discrepancies between our samples. Jun-c N-terminal kinase is a mitogen activated protein kinase, which respond when an organism is stressed (e.g. thermal shock, osmotic shock etc). Jun-c is related to several pathways involved in immunity, development, and stress in invertebrates.
We’re using less primers than in the original DNA-PCR because we want to be conservative and avoid primer-dimers.
Re-examined ASWA/TCBS plates from Arminia lesions
TCBS 7/22
Healthy 1 1 yellow
Healthy 2 1 yellow
Diseased 1 1 yellow/smooth
Diseased 2 zero
ASWA 7/22
Healthy 1 20 white cfu
Healthy 2 TNTC
Diseased 1 Q1 TNTC/ Q2 28 white smooth cfu
Diseased 2 TNTC white/smooth colonies
7/23 20 wh/2 pk 5 Q2 wh TNTC/45 Q2/4 Q3 TNTC/ 3 Q2
all wh/smooth, sm. CFU’s
Re-streaked healthy 1 and diseased 2 into 4th quadrat of plate
Re-examined plated Zostrea marina
Plated diseased (D) TCBS #2 onto TCBS Q2 and ASWA Q2
Plated healthy (H) TCBS #3 onto TCBS Q3 and ASWA Q3
Plated D ASWA #3 onto TCBS Q1 and ASWA Q1
Plated H ASWA #3 onto TCBS Q4 and ASWA Q4
July 22, 2010
Picnic Beach Intertidal Trip:
Collected diseased and apparently healthy Zostrea marina eel grass in addition to 25 Cancer magister crabs, several bivalves, and a Malibe nudibranch (smells like watermelon? maybe).
Morgan and I sectioned two diseased and two healthy Z. marina into 16 pieces, encompassing the leading edge of the disease when present. Eight pieces were plated onto marine agar (Difco 2216) and eight were plated onto TCBS agar, and parafilmed.
Tiffany and Lisa surface sterilized several healthy and diseased Z. marina with 95% Ethanol or sterile seawater (but not both) and inoculated QPX liquid media with several small pieces of grass in a 6-well format
CFU Counts on plates inoculated with Arminia lesion bacteria:
TCBS ASWA
1 2 3 4 1 2 3 4
Healthy 1 1 0 0 0 19 1 0 0
Healthy 2 1 0 0 0 TNTC 1 0 0
Diseased 1 1 0 0 0 TNTC 28 0 0
Diseased 2 0 0 0 0 TNTC 0 0 0
Littorina RNA Extraction:
1. Homogenize tissue in 1 ml TRI REAGENT using small pestel
2. Phase separate with chloroform to dissociate the nucleoprotein complexes
3. Precipate the RNA by mixing with isopropanol
4. Wash RNA pellet by vortexing with 75% EtOH
5. Solubolize the RNA in FORMAzol (stabilized formamide) (or 0.5% SDS, or water)
July 21, 2010
Arminia sp. Nudibranch Pathology
Rapid tissue necrosis is occurring along dorsal tissue of Arminia nudibranchs in the neuroethology class. The tissue becomes white and necrotic, spreading in a spotty pattern across the dorsal surface. The specimens were collected in Tacoma and transported to FHL. The skin disease appears to be highly virulent and infectious.
Bacterial Culture of Tissue Lesions:
Lesions and apparently healthy epidermal tissue was swabbed with sterile syringes and quadruple streaked onto TCBS (Vibrio-specific) and artificial seawater agar (ASWA). Plates were parafilmed and are being incubated at room temperature in Lab 10.
Healthy 1: posterior dorsal left side
Healthy 2: anterior region
Diseased 1: largest lesion on posterior dorsal side
Diseased 2: medium lession (of 3) near anterior end
Tissue Squash:
Scraped epidermal tissue from both diseased and apparently-healthy tissues and placed under a coverslip and viewed at 40X under the confocal. Ciliated protozoans were found in the diseased samples only, nothing was observed in the healthy samples. The protozoans were oblong and filled with green and brown spheres.
A gram stain was also conducted on several slides. We observed a large number of gram (+) rods in the sample from the lesion.
Histology:
A small piece of necrotic and a small piece of healthy tissue was preserved in 4% formalin for histology
Littorina DNA Extraction:
Extracted DNA using the Qiagen Stool Kit from 0.01 g apparently healthy tissue (MMS) and 0.02 g parasitized Littorina tissue (MLE#3)
100 ul final volume of DNA
Littorina PCR:
25 ul rxn
12.5 ul 2X Promega GoTaq
*35 = 437.5
1.5 ul 10X BSA 52.5
1.0 ul 20uM 27F 35.0
1.0 ul 20uM 1492R 35.0
2 ul DNA template
Thermal Profile:
95 C 10 min
95 C 30 sec
55 C 30 sec
72 C 50 sec
40 Cycles
72 C 8 min
4 C HOLD
July 20, 2010 (see my link to my Picasa web album here and in the discussion)
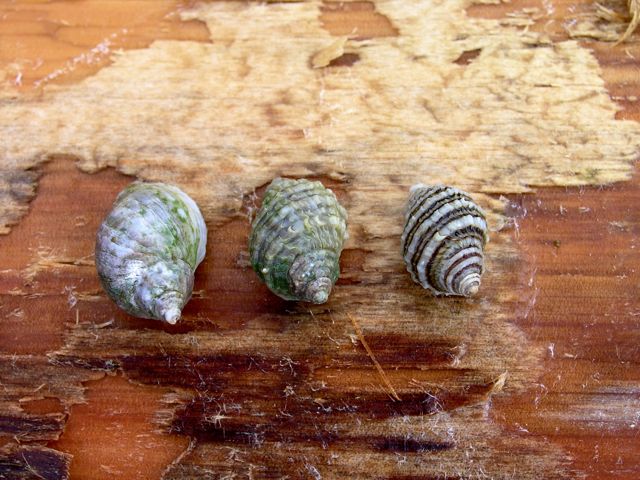
Field Trip to Cattle Point: Collected Littorina scutulata and Littorina sitkana to examine for trematode parasites within the digestive gland. L. scutulata was generally smaller than L. sitkana and had a slightly thinner/pointier shell with a checkerboard pattern. L. sitkana was generally the same size or larger with a striated shell. We also collected several Nucella for comparative purposes.
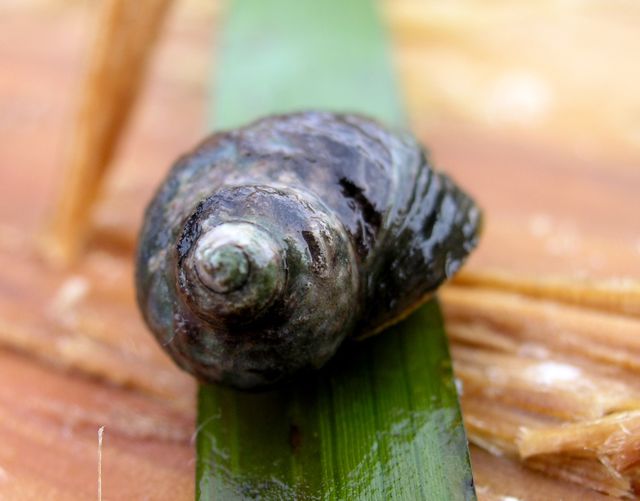 |
| L. sitkana |
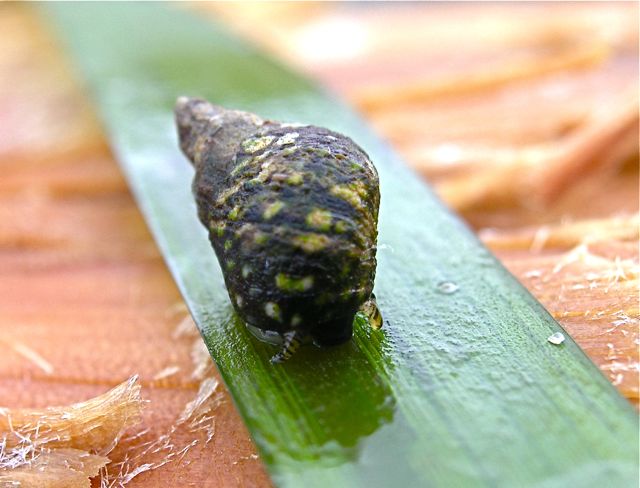 |
| L. scutulata |
 |
| Nucella |
Histology Overview: We examined histological slides of oysters and mussels.
Specifically identifying the oocytes, sperm, batman shaped instestinal cross-section (2) and stomach within an oyster digestive gland. We also identified Bonamia ostreae parasites within the connective tissue and epithelial tissue of the oyster digestive gland. The appear to be multi-nucleated cells sometimes surrounded by white space.
In a 2nd slide, I identified the sperm, gills, and foot muscle of Mytilus mussel tissue
In a 3rd slide, I identified Perkinsus marinus (Derma) parasites in oyster epithelial and Haplosporidium nelsoni (MSX) also in oyster tissue.
Dissection: I dissected 6 L. sitkana and 2 L. scutulata by
1. Cracking the shell and carefully extracting the gastropod body.
2. Using aseptic technique we sliced off the digestive gland from the tip of the snail body and examined the contents under a dissecting scope for parasitic infections.
3. Removed the operculum and head region and preserved a small piece of foot for DNA extraction in a microcentrifuge tube at -80 C.
4. Preserved the remaining body for RNA stress enzyme analysis by placing in an RNase free microcentrifuge tube on dry ice and at -80 C.
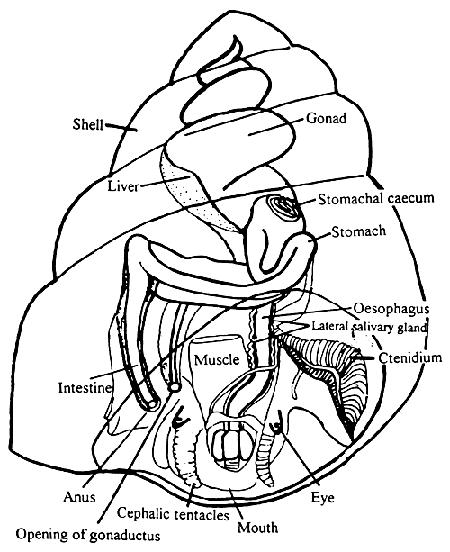
I personally preserved 5 specimens (4 L. sitkana and 1 L scutulata) for DNA and RNA analysis. For reference see the diagram below from: [[@http://www.fao.org/docrep/field/009/ag150e/ag150e03.htm |Snail]]
July 19, 2010
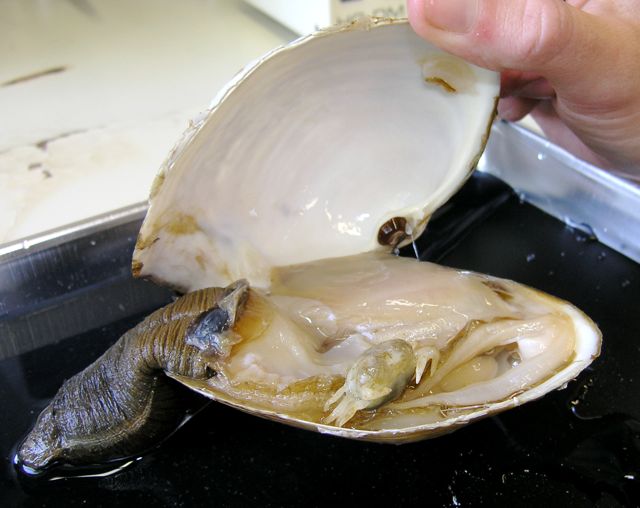
Dissection: Panopea generosa, also known as a Geoduck pronounced "Gooey Duck", which is a large saltwater clam in the family Hiatellidae that is native to the Pacific Northwest (PNW). Interesting fact: May be one of the longest living organisms in the Animal Kingdom, having a life expectancy of ~146 yrs, with the oldest recorded at over 160 yrs.
Emma severed the adductor muscle from the shell using a blunt flat blade allowing us to open the shell
We identified the mantle tissue, ctenidia (gills), foot, and very muscular incurrent/excurrent siphons
Within the foot we identified the digestive glands and reproductive organs, and potentially the heart
